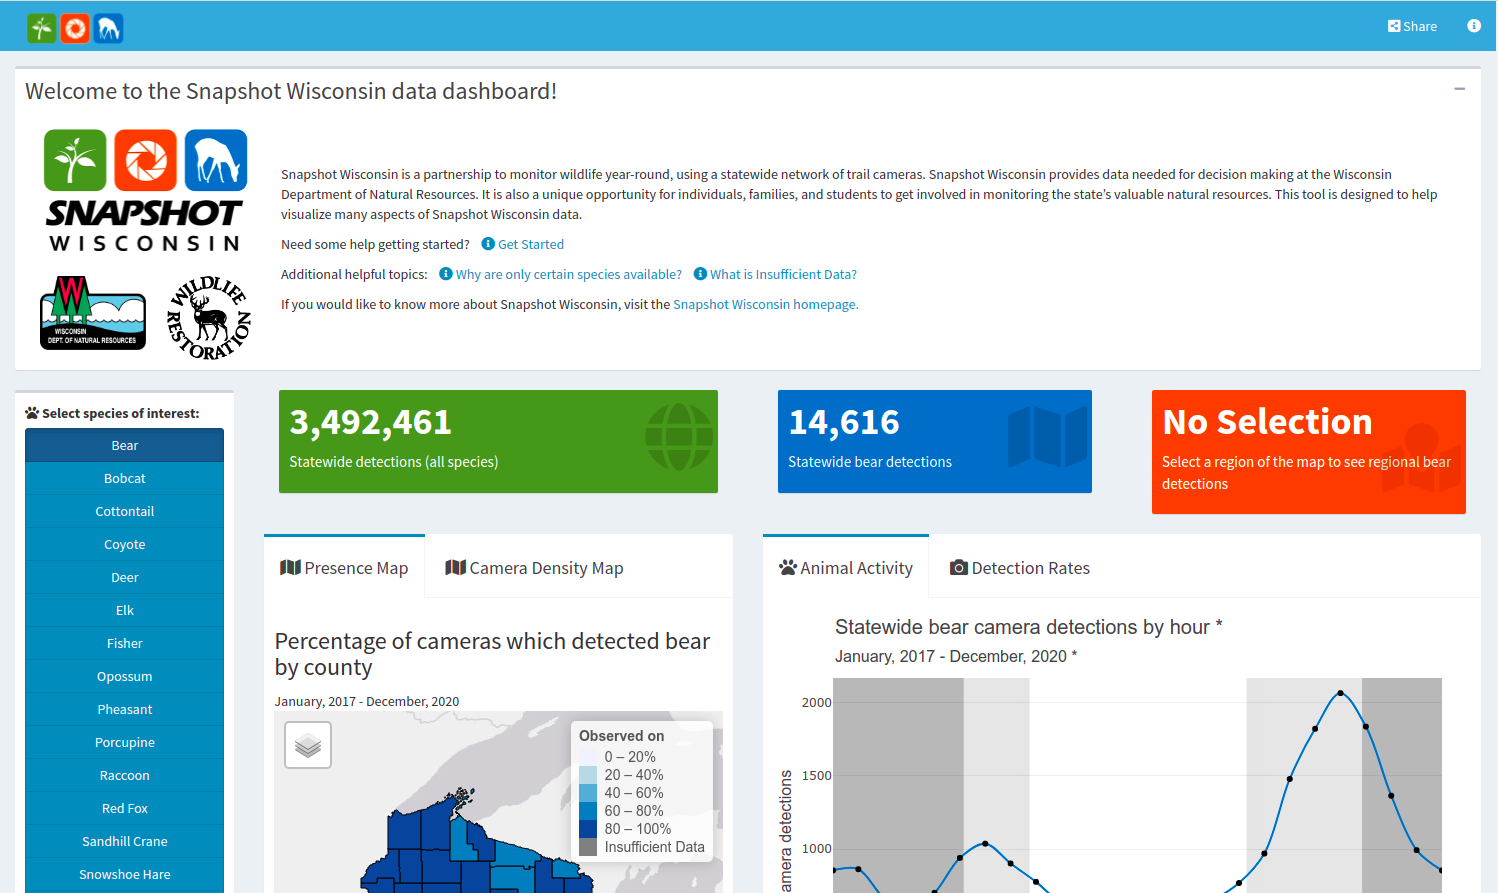
The Snapshot Wisconsin Data Dashboard is a data visualization application using R and the Shiny package. The purpose is to visualized Snapshot Wisconsin species classification data for public use. Future iterations will be used to help species specialists and species committees make decisions. This was the first successful effort to share Snapshot Wisconsin data with the public on an ongoing basis.
The goal of the Data Dashboard is to share detection information in an interactive, exploratory, and interpretable manner. This was accomplished by using an externally exported and transformed version of the Snapshot Wisconsin production database which aggregates and summarizes data temporally, spatially, and categorically (by species). Transforming the data in this way allows the data to be more interpretable and explorable by nearly anyone.
Making the data interactive and publicly available was made possible by the Shiny package. This package not only allows for a web interface to be produced, as can be done with R markdown, but a back end is also created. This allows for R code to run reactively based on user input. New plots are created and shown based on the nearly infinite possible selections a user could make (it's actually just over 35,000,000 unique combinations with data from 2018 to 2022).